
Free demo
Readiness brief
Is this workflow ready for automation? Six sections to complete before any decision.
Download the automation-readiness brief (PDF, 4 pages)Working demo
A shared inbox where every message becomes an owned action, reviewed before it moves.
Open the Inbox to Actions demoFew organisations know how long their work takes.
What we do
Where the time goes is measured before anything is changed.
If a request passes through three inboxes before anyone acts on it, or part of every day goes on answering chasers, the written procedure will not show where the time goes. The headline measure may not show it either: a completion rate counts the work that finished, not the work that was cancelled, repeated or still waiting.
We watch the process run at the desks where it happens, take timings from your systems' own records where they exist and from short time samples where they do not, and count the contacts a first-time fix would have prevented.
We rank the changes by value against effort and show the method and sample behind each estimate. We also build software, and we say so when a recommendation could lead to work for us: the answer may be a process change, better use of a tool you already own, a product to buy, or no change at all.
Three published figures on measuring work
HMRC's failure demand figure is its own estimate. It counts calls caused by customers' errors as well as its own delays, and chasers made before HMRC's target response times had passed. The repairs figures come from social landlords with 1,000 or more homes; the regulator counts repairs cancelled by the landlord or tenant, and notes significant variation across landlords. The ONS scores are official statistics in development, corrected on 5 July 2024. They cover firms with 10 or more employees and exclude agriculture, financial services and the public sector.
What a workflow review produces
Commission a single offering, or run the three phases from mapping to ranking. Before-and-after measurement repeats the baseline once a change is live. Every estimate carries the method and sample behind it.
Process mapping
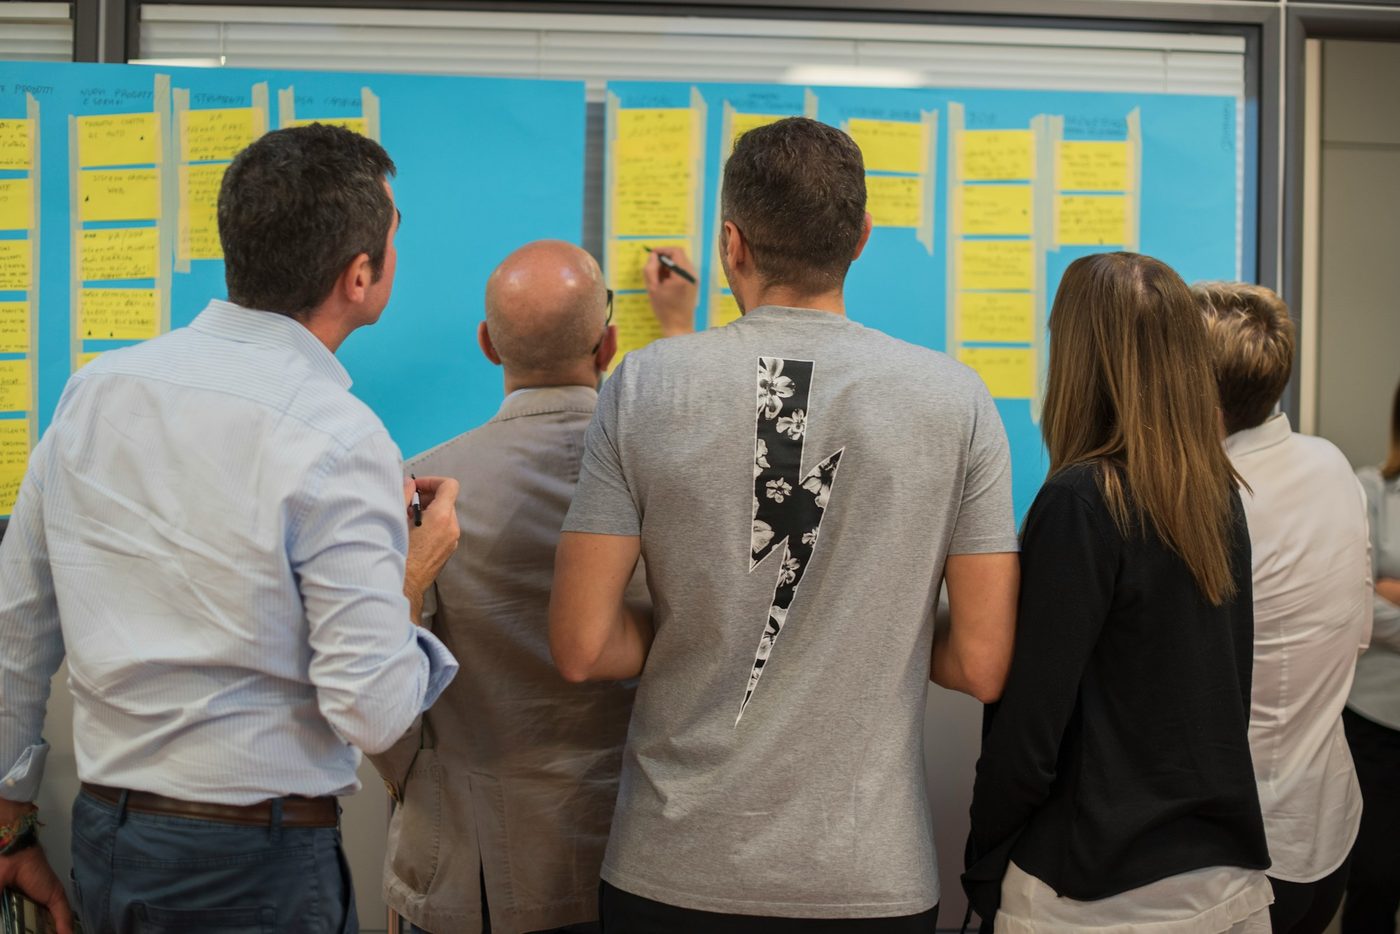
Map the process as it runs, in swimlanes that show the handoffs, waits and rework loops between people and systems. Mark each place where the work departs from the written procedure, and agree the map with the people who do the work.
- Current-state swimlane map in BPMN 2.0 notation
- SIPOC summary: suppliers, inputs, process, outputs, customers
- RACI chart for each decision and approval step
- Future-state map for the changes you choose to make
- Files in PDF and BPMN 2.0 XML, so you can keep editing them
Failure demand analysis
Count the contacts caused by something not done, or not done right, the first time: chasers, repeat calls, corrections and complaints. Trace each one to the step that caused it, and separate it from the demand the process exists to serve.
- A sample of contacts from phone logs, shared inboxes and case or ticket exports
- Each contact classed as value or failure demand, with the written rule used to class it
- Each failure traced to the step and cause that created it
- The avoidable share, stated with the size and period of the sample
Time and volume baseline
Measure how much of the elapsed time is work and how much is waiting, from system timestamps where they exist and short time samples where they do not. Record the method with the numbers, so the same measure can be repeated after a change.
- Volume by channel and by week, from case, ticket, order or email exports
- Cycle time against touch time, with queue time at each handoff
- Rework rate: the share of items sent back, corrected or reopened
- Event-log analysis where your systems record a case ID, an activity and a timestamp
- A method note: sources, sample size, period and known gaps
Before-and-after measurement
Repeat the baseline after a change, with the same method, sources and sampling rules, to show what moved and what did not. Report every measure, including the ones that did not improve.
- The original baseline method re-run without changes
- Cycle time, queue time, rework and failure demand compared side by side
- Other changes in the period noted, such as seasonal volume or staffing
- A one-page result for the people who approved the change
Automation candidate assessment
Score each step on volume, rule-following and exception rate, and work through the six sections of the automation-readiness brief for each candidate. Separate what a rule can do, what software can prepare for a person to check, and what needs a person to decide.
- A score for each step on volume, rule-following and exception rate, with its evidence
- Each step placed as rule-based, prepared for a person to check, or left to a person's judgement
- The records each candidate needs, their owner and who can approve their use
- The systems and integrations each candidate touches, and who controls each one
- A review point and exception route for any step handed to software
Opportunity ranking
Rank the changes by value against effort, with every assumption behind each estimate visible and adjustable. Set process changes, better use of tools you already own, products to buy and bespoke builds side by side.
- Value-against-effort matrix, with the method and sample behind every value
- An assumptions table you can edit: volume, time per item, adoption, running cost
- Each option classed as process change, configuration, product purchase, bespoke build or no change
- A recommended first step, what it would take, and the measure that would show it worked
What you get
What the timings show
- The people who do the work agree the map, and it shows the handoffs, waits and rework loops as the process runs today.
- You know how much of the elapsed time is work and how much is waiting, by a method you can repeat after any change.
- Choose the first change from a ranked list, with the method and sample behind every estimate.
From the publication
What the automation-readiness brief asks
The brief is the method behind the automation candidate assessment. Complete it with your operations lead, technical owner and decision-maker, and bring the gaps to the first conversation.
- 01
1. Define the work
Question: What starts the workflow? Capture: a one-sentence scope and a named owner.
- 02
2. Establish the starting point
Question: Where is time spent? Capture: a baseline with its measurement method and known gaps.
- 03
3. Understand the information
Question: Who can approve its use and access? Capture: a source list, access owner and unresolved information questions.
- 04
4. Map the dependencies
Question: What happens if a dependency is unavailable? Capture: a dependency map with an owner for each connection.
- 05
5. Design the review
Question: Who can amend, reject or approve the output? Capture: a review point, an exception route and representative test examples.
- 06
6. Decide what would justify investment
Question: What result would cause you to expand, change or stop? Capture: a proposed first stage and an explicit decision point.
A planning aid, not a certification, audit or automatic readiness score.
How it runs
How a workflow review runs
- 01
Scope and brief
We agree one process with a named owner, where it starts and ends, and which system exports and people we need. Your team completes the automation-readiness brief with us, so the gaps are known at the start.
- 02
Observation and data collection
We sit with the people who do the work, take exports from your case, ticket, order or email systems, and run short time samples where no timestamps exist. We draw the current-state map and walk it with the team that runs the process.
- 03
Measurement and classification
We calculate cycle, touch and queue time, class each sampled contact as value or failure demand, and score each step for automation. The method, sample and known gaps sit beside every number.
- 04
Ranking and handover
We rank the changes by value against effort, recommend a first step, and present the findings to the people who will decide. You keep the maps, the data, the assumptions and the method, so the baseline can be repeated after any change.
Read and try
Read the research. Open the demo.

Readiness brief
Is this workflow ready for automation?Readiness brief
Is this workflow ready for automation?
Its six sections, from defining the work to deciding what would justify investment, are the questions the automation candidate assessment works through. Start it before the first conversation and bring the gaps with you.
Download the automation-readiness brief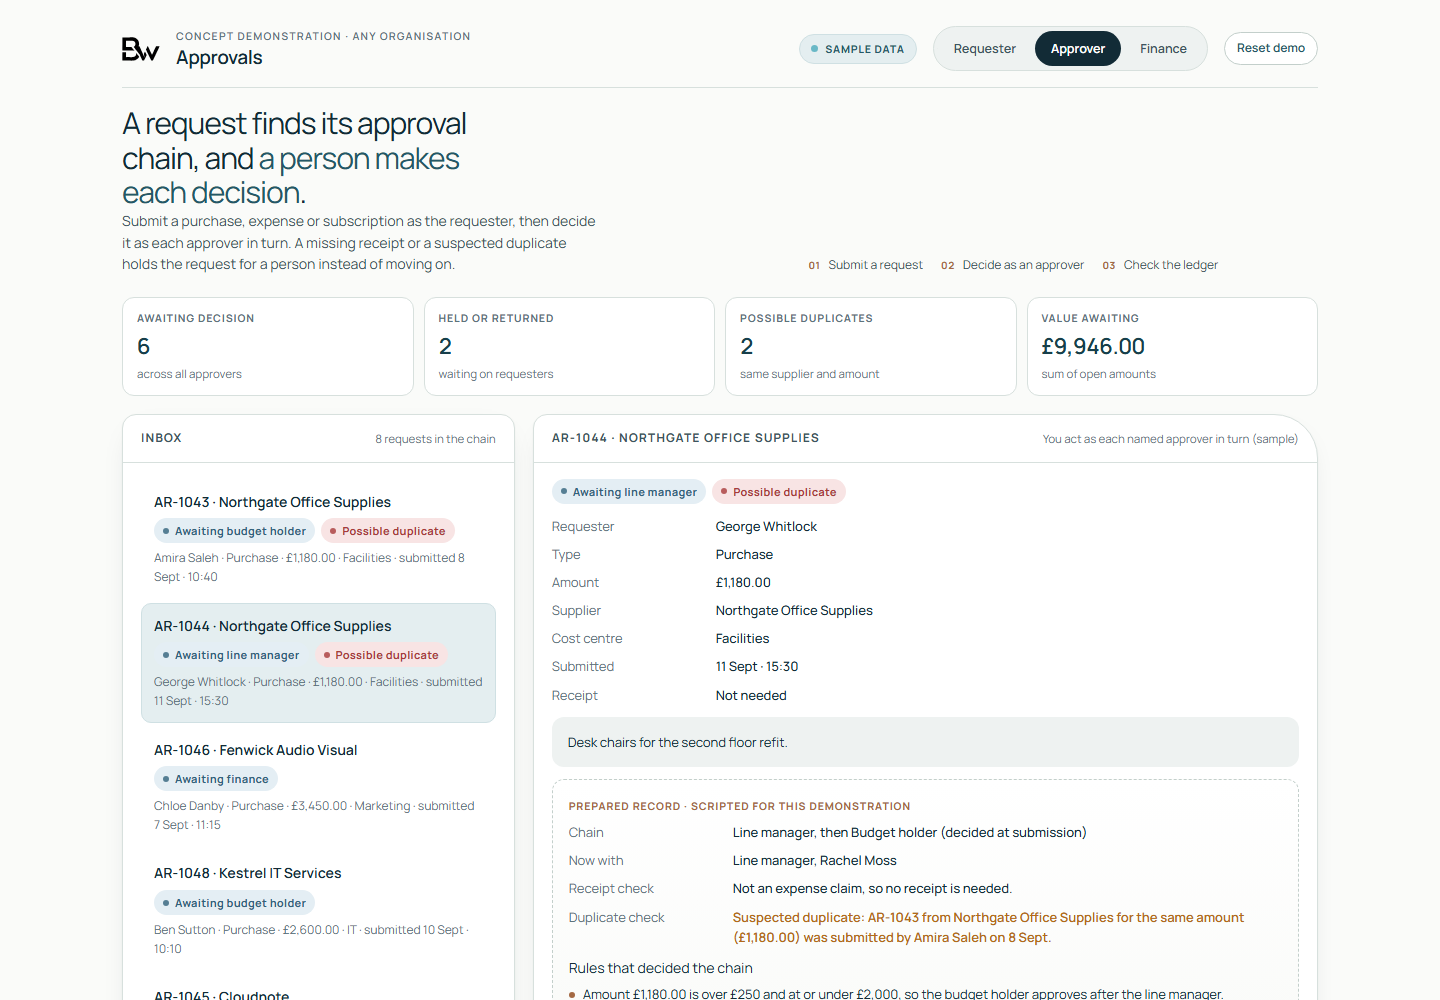
Working demo, on sample data
- A purchase request finding its approval chain from illustrative thresholds, then decided by each approver in turn.
- A missing receipt or a suspected duplicate order held for a person to resolve.
- Finance totals by cost centre against budget, on fictional sample data.
Worth asking first
- Which step generates the most chasing, and who answers the chasers?
- Of the contacts your team handled last month, how many would not have happened if the first response had been complete?
- What does your headline measure leave out: work that was cancelled, reopened or is still open?
- Which of your systems records when each item arrived, moved and closed?
- Which approval could move to a written threshold without increasing risk, and who would have to agree?
Talk to us if
- Your team re-keys details from emails or forms into a second system.
- Requests wait in a shared inbox with no measured wait time.
- Chasers and repeat calls take up part of every day, and none of that time is counted.
- A process change or an automation purchase is proposed, and there is no baseline to measure it against.
- A business case rests on an estimate of time saved that nobody can trace to a sample.
- The same item is checked twice because two teams do not trust each other's record.
Questions
Questions buyers ask
Do you install monitoring or process-mining software on our systems?
No. We work from exports your systems already produce, such as case, ticket, order or email logs with an ID, an activity and a timestamp, and we agree with you what personal data they contain before we receive them. Where no timestamps exist, we run short time samples with the people doing the work. The baseline reports on the process, not on named individuals.
Will the recommendation always be new software?
No. We also build software, so we say so whenever a recommendation could lead to work for us, and we name the alternatives. The ranked list sets process changes, configuration of tools you already own, products you could buy and bespoke builds side by side, and no change is a valid result for any step.
How do you put a value on each change?
Every value is a calculation you can check: volume from your records, time per item from the baseline, and the assumptions written beside it. The ranking states the sample size and period behind each number, and you can change the assumptions in the model we hand over. An estimate is not a result; the before-and-after measurement is how you find out what a change delivered.
Is this a Lean or Six Sigma programme?
No. We use tools from both where they help, such as value stream maps, SIPOC and the Lean categories of waste, but we do not run improvement programmes, belt training or certification. The work is a review of one process at a time, and the report is yours to act on with us, another supplier or your own team.
How much staff time does a review take?
A named process owner, time with the people who do the work while they do it, and system exports agreed in advance. The staff time we ask for is set at scoping and written into the proposal before anything starts.
You keep the method, so you can repeat it.
We map one process, measure it by a method you keep, and rank what to change first.
Request a workflow review